Skip to content




The United States borrowed nearly $2 trillion in 2026 despite collecting record tax revenue. National debt surpassed $40 trillion, annual interest payments crossed $1 trillion for the first time, and trillions in older government debt must soon be refinanced. The numbers reveal a growing financial problem with consequences for taxpayers, businesses, and retirement investors.
Written by Pat Collins and John J. Halloran | 5.0 Google Review Rating | A+ BBB Rating with Zero Complaints | Serving 58,000+ Investors in All 50 States Since 1992
What You’ll Learn
- How America’s annual budget deficit increased approximately 45% from 2022 through 2026, including the spending and revenue figures for each year.
- Why the government now spends the equivalent of 37 cents on debt interest for every dollar collected in individual income taxes.
- How $10.6 trillion in maturing Treasury securities exposes federal finances to changing interest rates.
- Why the 2026 Supreme Court tariff ruling, corporate tax changes, and growing entitlement expenditures widened the deficit.
- What growing deficits mean for inflation, the U.S. dollar, future taxes, retirement savings, and the outlook through 2036.
The 2026 U.S. Budget Deficit Reached $1.992 Trillion
On October 16, 2026, the Treasury Department reported that the federal government ended fiscal year 2026 with a $1.992 trillion deficit, approximately $217 billion more than the previous year.
Federal spending reached $7.4 trillion while revenue totaled $5.4 trillion. Washington spent roughly $1.37 for every dollar it collected, borrowing the difference.
That translates into approximately $5.5 billion borrowed every day, or $230 million every hour, throughout the fiscal year.
The 2026 deficit was the third-largest in American history in nominal dollars, exceeded only by the extraordinary pandemic deficits of 2020 and 2021.
What makes the latest figures troubling is their economic context. America was not experiencing a pandemic shutdown or a conventional recession. The government borrowed nearly $2 trillion while collecting more tax revenue than ever before.
The federal deficit is no longer primarily an emergency financing problem. It is embedded in the government’s ordinary operations.
Source: U.S. Treasury — Federal Fiscal Data.
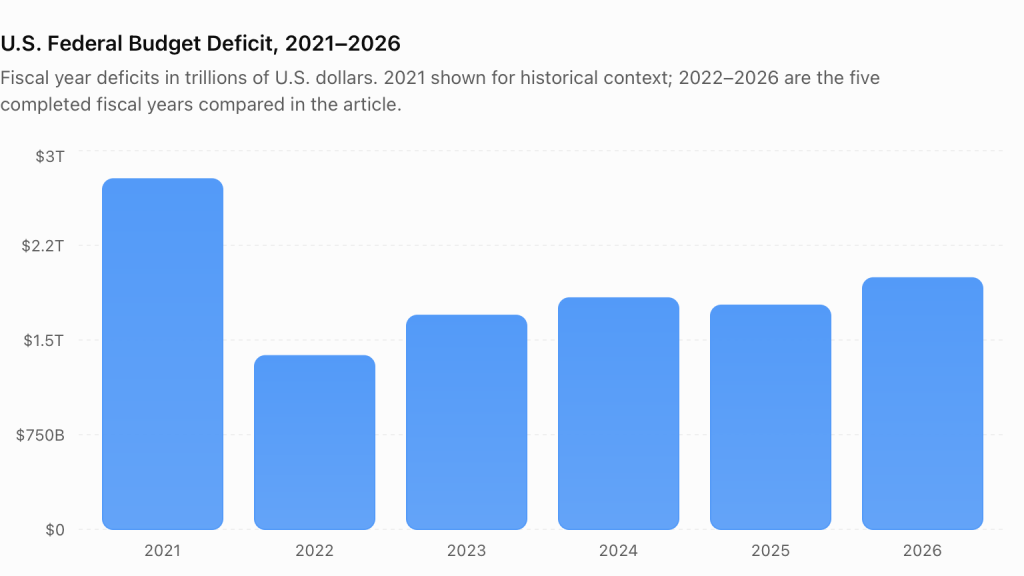
U.S. Budget Deficit by Year: 2021–2026
The five-year record reveals how quickly the temporary improvement following pandemic spending disappeared.
Fiscal year | Annual deficit | Change |
2021 | $2.776 trillion | Pandemic spending |
2022 | $1.375 trillion | −50.5% |
2023 | $1.695 trillion | +23.3% |
2024 | $1.833 trillion | +8.1% |
2025 | $1.775 trillion | −3.2% |
2026 | $1.992 trillion | +12.2% |
Source: U.S. Treasury. Fiscal years end September 30. Figures rounded.
The deficit fell sharply in 2022 as emergency pandemic programs expired. Since then, the underlying imbalance has returned.
From 2022 through 2026, the annual deficit increased approximately 45%. Even using the more recent 2024 comparison, it increased approximately 8.7% in two years.
Across the five completed fiscal years, federal deficits totaled approximately $8.67 trillion.
Measured against the economy, the 2026 deficit equaled approximately 6.1% of GDP, according to the American Action Forum’s Treasury-based calculation. That compares with 5.8% in 2025 and a 50-year historical average of 3.8% reported by the Congressional Budget Office.
Deficits can be justified during national emergencies. Sustaining enormous deficits during periods of economic growth is a different problem entirely.
If Washington must borrow nearly $2 trillion when the economy is functioning, what happens when the next serious recession arrives?
Why Record Tax Revenue Failed to Reduce the Deficit
Federal revenue increased approximately $169 billion in 2026, or 3%. Unfortunately, spending increased $386 billion, or 6%.
The government collected more money but spent additional money twice as quickly.
The changes in major revenue categories help explain why.
Revenue source | Change from 2025 |
Individual income taxes | +$189 billion |
Payroll taxes | +$63 billion |
Corporate income taxes | −$71 billion |
Customs duties | −$22 billion |
Estate and gift taxes | +$9 billion |
Higher wages and salaries produced more individual income-tax and payroll-tax revenue. However, corporate income-tax receipts declined approximately 16%, from $452 billion to $381 billion.
Business tax provisions enacted in 2025, including expanded deductions for qualifying investments, contributed to that decline.
Those changes may encourage business investment, but they also reduce near-term federal revenue. Policymakers must evaluate both effects rather than assuming future economic growth will automatically cover today’s revenue losses.
The most dramatic revenue surprise came from tariffs.
The 2026 Tariff Reversal: Billions Collected, Then Refunded
On February 20, 2026, the Supreme Court ruled that the International Emergency Economic Powers Act did not authorize the challenged presidential tariffs.
The decision triggered a substantial refund process for duties previously collected under that authority.
According to the American Action Forum’s analysis of Treasury data, approximately $130 billion in eligible refunds had been issued by the end of fiscal 2026, against an estimated $166 billion eligible under its accounting.
Net customs-duty revenue declined approximately 11%, from $195 billion in 2025 to $173 billion in 2026.
Importantly, the ruling did not eliminate every American tariff. Duties imposed under other legal authorities, including Section 232 national-security tariffs and Section 301 trade measures, remained in force.
The episode demonstrated how quickly expected revenue can disappear when major policy decisions face legal challenges.
A revenue strategy that depends on uncertain legal authority is not a dependable solution to a structural federal deficit.
Where the Money Went: The Largest Spending Increases
Federal expenditures rose by approximately $386 billion in 2026. Much of the increase came from programs governed by existing laws rather than ordinary annual congressional appropriations.
Spending category | 2026 total | Annual increase |
Social Security | $1.7 trillion | +$86 billion |
Medicare | $1.1 trillion | +$76 billion |
Medicaid | $723 billion | +$55 billion |
National defense | $965 billion | +$49 billion |
Veterans’ benefits and services | $416 billion | +$39 billion |
Net interest | $1.05 trillion | +$81 billion |
Social Security costs increased because of more beneficiaries and the 2026 cost-of-living adjustment. Medicare and Medicaid expenditures rose because of enrollment, healthcare costs, and payment changes.
Defense spending also increased, reflecting personnel, operations, research, and military commitments.
Meanwhile, substantial reductions occurred elsewhere. Environmental Protection Agency spending fell approximately 53%, and Commerce Department spending declined 50%, together representing about $34 billion in reductions.
Social Security spending alone increased $86 billion.
This illustrates why promises to eliminate the deficit by trimming smaller federal agencies are financially inadequate.
Government waste deserves attention, but even dramatic reductions in individual agency budgets cannot erase a $2 trillion deficit dominated by major programs and interest expenses.
The $1 Trillion Interest Bill: America’s Most Important Financial Warning
In fiscal 2026, the United States crossed a historic threshold.
Annual net interest payments on federal debt exceeded $1 trillion for the first time, reaching approximately $1.05 trillion.
That represents roughly $2.9 billion every day spent financing government borrowing.
Net interest became the federal government’s third-largest expenditure category, behind Social Security and Medicare, and exceeded national defense spending.
The amount is even more striking when compared with income-tax collections.
For Every $1 Collected in Individual Income Taxes, 37 Cents Went to Interest
The federal government collected approximately $2.8 trillion in individual income taxes during 2026.
Net interest expenses of $1.05 trillion equaled approximately 37 cents for every dollar collected in individual income taxes.
That is a comparison of spending with one revenue category, not a claim that particular tax dollars are legally earmarked for interest payments.
Nevertheless, it illustrates the scale of the burden.
Interest payments do not directly finance additional roads, schools, medical services, or national defense equipment. They compensate creditors for money the government previously borrowed.
The problem becomes more serious as the debt expands and Treasury financing costs increase.
Why America’s Borrowing Costs Are Rising
In September 2021, the average interest rate on marketable Treasury securities was approximately 1.47%.
By September 2026, it had reached 3.52%.
The average financing rate more than doubled in five years while the amount of debt outstanding increased dramatically.
This combination creates a mathematical problem: More debt is being financed at higher rates.
Unlike certain government expenditures, interest payments cannot simply be canceled through a routine appropriations decision without violating financial obligations.
The federal government must either finance them, reduce borrowing needs elsewhere, or undertake broader fiscal changes.
America is paying substantially more to finance substantially more debt. That is the combination threatening future federal budgets.
The $10.6 Trillion Treasury Refinancing Problem
A less widely understood risk involves the enormous quantity of Treasury securities approaching maturity.
As of September 30, 2026, approximately $10.64 trillion in marketable Treasury debt was scheduled to mature within the following 12 months, according to data derived from Treasury’s Monthly Statement of the Public Debt.
That is roughly one-third of publicly held federal debt.
When these securities mature, Treasury must repay them. If it does not retire the principal from available funds, it typically issues new securities to refinance the obligations.
Older securities issued at low rates may therefore be replaced by new borrowing carrying substantially higher yields.
Source: U.S. Treasury — Monthly Statement of the Public Debt.
What Happens If Treasury Yields Rise Another Percentage Point?
TD Securities estimated that a one-percentage-point increase across Treasury yields could add approximately $310 billion to federal interest expenses in 2027 under its modeled assumptions.
That is a scenario, not a prediction that interest expenses will increase by precisely that amount.
The longer-term risks are equally concerning.
The independent, nonprofit Committee for a Responsible Federal Budget estimated that if interest rates remain approximately one percentage point above Congressional Budget Office projections, annual interest costs could reach $2.8 trillion, or 5.9% of GDP, by the end of the decade.
Those are conditional estimates and depend on future borrowing, interest rates, and economic growth.
But the underlying mechanism is clear.
Higher borrowing costs increase interest payments. Larger interest payments can widen deficits, requiring more borrowing. Additional borrowing can create further pressure on future financing costs.
The danger is not merely America’s $40 trillion debt balance. It is the possibility that the cost of carrying that debt grows faster than the government’s ability to finance it comfortably.
National Debt Surpassed $40 Trillion: What That Actually Means
Gross federal debt exceeded $40 trillion in August 2026.
However, gross national debt differs from debt held by the public.
Gross debt includes obligations held by federal government accounts. Publicly held debt represents borrowing from outside federal government accounts, including investors, financial institutions, and Federal Reserve holdings.
Debt held by the public increased approximately $2 trillion during fiscal 2026, reaching about $32.4 trillion.
That represented approximately 100% of GDP, nearly twice the 50-year historical average of 51%.
For perspective, publicly held federal debt peaked near 106% of GDP shortly after World War II.
A high debt ratio does not automatically produce a financial crisis. The United States benefits from the dollar’s international role, substantial economic resources, and exceptionally deep capital markets.
Those advantages are real. They do not eliminate the need to finance interest expenses or stabilize the long-term debt trajectory.
What Rising Deficits Mean for Inflation, Interest Rates, and the Dollar
Federal deficits can influence economic conditions through several channels.
Government borrowing may increase demand for available capital, potentially contributing to higher long-term interest rates. Higher Treasury yields can influence mortgages, business loans, and investment valuations.
Deficit spending can also increase economic demand. When production cannot expand sufficiently to meet that demand, additional inflationary pressure may follow.
However, deficits do not automatically cause inflation or weaken the dollar. Federal Reserve policy, productivity, investor confidence, foreign capital flows, and global economic conditions also matter.
The dollar remains the dominant international reserve currency, and U.S. Treasury securities continue to attract substantial global demand.
The long-term concern is whether persistent deficits and increasing financing costs gradually weaken fiscal flexibility and confidence in future purchasing power.
A country can maintain strong financial markets while accumulating serious long-term fiscal problems.
What Does the Deficit Mean for Retirement Savings?
For retirement investors, government borrowing matters because it can influence inflation, bond yields, investment volatility, and future tax policies.
Inflation reduces purchasing power when income or investment returns fail to keep pace with living costs. Higher interest rates can lower the market value of existing fixed-rate bonds while increasing yields on newly issued securities.
Stocks may also experience volatility as businesses face changing financing costs and investors reassess future economic growth.
None of these developments guarantees a particular market outcome. The practical lesson is to understand investment risks, maintain appropriate liquidity, and avoid relying on a single economic forecast.
Where Gold and Silver Fit
Precious metals can attract investor demand during periods of inflation concern, financial uncertainty, and declining confidence in currencies.
Gold has a long history as a monetary asset and is traded internationally. Silver also has substantial industrial demand, giving it different market characteristics.
Neither metal guarantees protection from inflation, recession, or federal debt problems. Prices fluctuate, and dealer premiums and resale spreads affect investment returns.
Investors considering physical bullion should understand product recognition, purchase prices, liquidity, and transaction costs.
For more information, read our Gold Investment Guide and Silver Investment Guide.
What the Congressional Budget Office Projects Through 2036
The Congressional Budget Office’s February 2026 outlook projects that annual federal deficits could reach approximately $3.1 trillion by 2036 under its baseline assumptions.
Debt held by the public is projected to reach 120% of GDP, exceeding the historical post-World War II peak.
Net annual interest expenditures are projected to reach approximately $2.1 trillion by 2036.
These forecasts assume laws and economic conditions consistent with the baseline’s methodology. Future legislation, changes in interest rates, recessions, or stronger economic growth could significantly alter the outcome.
Nevertheless, the projections reveal an important concern: Continued large deficits can push federal debt to historically unprecedented levels relative to the economy.
The longer meaningful adjustments are delayed, the more difficult future fiscal choices may become.
Can America Fix Its Budget Deficit?
Yes, but not through slogans, minor spending cuts, or optimistic revenue assumptions.
Eliminating the 2026 deficit through additional revenue alone would require an increase equivalent to approximately 37% of existing federal receipts. Eliminating it entirely through spending reductions would require cuts equivalent to approximately 27% of current expenditures.
Those percentages are illustrative measures of the gap, not recommended policies.
A credible solution requires evaluating large spending commitments, healthcare costs, Social Security financing, taxes, economic growth, and interest expenses.
Reducing waste and improving efficiency are worthwhile, but the arithmetic demonstrates why those measures cannot solve the problem independently.
Policymakers can reasonably disagree about the appropriate combination of spending restraint and revenue changes. What they cannot do is make the fiscal imbalance disappear by avoiding difficult decisions.
The question is not whether America has the financial capacity to improve its budget. It is whether Washington will make meaningful adjustments before interest costs limit the available choices.
Frequently Asked Questions
What Was the U.S. Budget Deficit in 2026?
The federal government recorded a $1.992 trillion deficit in fiscal 2026, an increase of approximately 12.2% from 2025.
How Much Has the U.S. Deficit Increased in Five Years?
The annual deficit increased approximately 45% from fiscal 2022 to fiscal 2026. The exceptionally large 2021 pandemic deficit is shown separately for historical context.
How Much Does America Pay in Interest on Its National Debt?
Net interest costs reached approximately $1.05 trillion in 2026, exceeding $1 trillion annually for the first time.
What Percentage of Federal Revenue Goes Toward Interest?
Net interest equaled approximately 19% of total federal revenue in 2026. Compared specifically with individual income-tax receipts, the amount was equivalent to approximately 37 cents for every dollar collected.
Will America’s National Debt Cause a Financial Crisis?
A crisis is not inevitable. However, increasing debt, refinancing exposure, and persistent deficits can create greater economic vulnerability and reduce future fiscal flexibility.
Does a Growing Budget Deficit Make Gold a Better Investment?
Deficits may increase investor interest in gold, but federal borrowing does not reliably predict gold prices. Investors should evaluate diversification, transaction expenses, and risk rather than assuming that fiscal problems guarantee appreciation.
The Bottom Line: America’s Greatest Financial Risk May Be Gradual
The United States remains an extraordinarily productive economy with major technological advantages, deep capital markets, and global financial influence.
But those strengths do not make the budget numbers disappear.
In 2026, Washington borrowed nearly $2 trillion, federal debt exceeded $40 trillion, and net interest expenses surpassed $1 trillion.
The annual deficit increased approximately 45% since 2022, while average interest rates on marketable Treasury debt more than doubled over five years.
With more than $10 trillion in Treasury securities maturing within one year, future financing costs remain an important risk.
America’s greatest financial danger may not be a sudden collapse. It may be the gradual surrender of future economic choices as interest on yesterday’s borrowing consumes more of tomorrow’s revenue.
For taxpayers, businesses, and retirement investors, understanding that risk matters more than political promises about balancing the budget someday.
The nation has the resources to address its fiscal problems. What remains uncertain is whether its leaders will make the necessary decisions before financial pressure makes those decisions considerably more difficult.
Sources and Important Information
- U.S. Treasury — Federal Fiscal Data
- Congressional Budget Office — Budget and Economic Outlook, 2026–2036
- U.S. Treasury — Monthly Statement of the Public Debt
- American Action Forum — Fiscal 2026 Federal Deficit Analysis
- Committee for a Responsible Federal Budget — Washington Needs a Fiscal Intervention
- Tax Foundation — Supreme Court Tariff Ruling Analysis
Published October 2026. Fiscal-year figures are based on Treasury reporting and may be revised. Economic forecasts and interest-rate scenarios are conditional estimates, not guaranteed outcomes.
This article is intended for educational purposes and does not constitute personal financial, investment, tax, or legal advice. Certified Gold Exchange is a precious-metals dealer. Precious-metals investments involve market risk, and investors should consider their individual objectives and transaction costs.